- R 소개
- 기초 함수 및 변수 다루기
- 데이터 핸들링
R 강의
첫번째 시간
김형준
Data Analyst
Contents
R
- R 언어는 통계 계산과 그래픽을 위한 프로그래밍 언어
S-PLUS -> R (1997, GNU PROJECT)
한계 : R’s biggest challenge is that most R users are not programmers
극복 : Solving the “Two-Language” Problem
설치
적절한 code editor 고르기
예) R Studio
Introduction
- The "Comprehensive R Archive Network" (CRAN)
is a collection of sites which carry identical material, consisting of the R distribution(s), the contributed extensions, documentation for R, and binaries.
장점
- Freeware
- 대화식 프로그램
- 방대한 라이브러리
- 다양한 OS 지원 / Java, C, Fortran 프로그래밍 인터페이스
- 다양한 그래픽 지원
단점
- Freeware --> 저자 마음대로 input 설정
- 국내자료가 부족
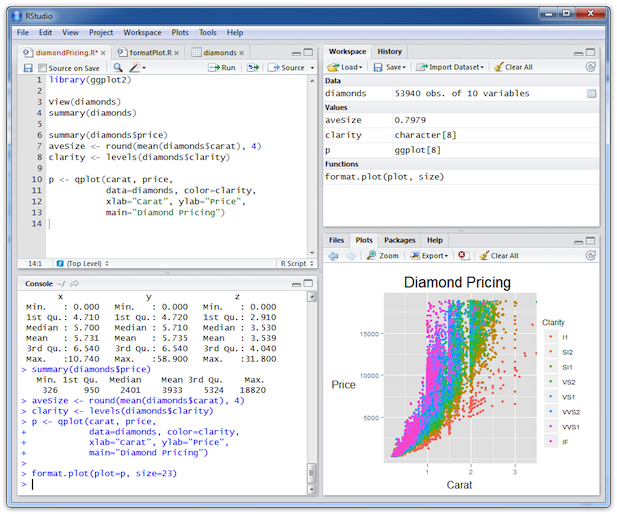
R Demo
기초연산 & 변수 다루기
| func | func | ||
|---|---|---|---|
| + - * / ^ | 단순계산 | ||
| sqrt(x) | 제곱근 | ceiling(x) | 올림 |
| floor(x) | 내림 | abs(x) | 절댓값 |
| trunc(x) | 버림 | log(x) | 자연로그 |
| round(x) | 반올림 | round(x,n) | 소수점 n 까지 반올림 |
| factorial(n) | n! | choose(n,k) | nCk |
예)
factorial(3)
[1] 6
round(25.233,1)
[1] 25.2
패키지(라이브러리)
head(installed.packages())
##           Package
## abind     "abind"
## acepack   "acepack"
## acss.data "acss.data"
## ACTCD     "ACTCD"
## ada       "ada"
## adabag    "adabag"
##           LibPath
## abind     "/Library/Frameworks/R.framework/Versions/3.1/Resources/library"
## acepack   "/Library/Frameworks/R.framework/Versions/3.1/Resources/library"
## acss.data "/Library/Frameworks/R.framework/Versions/3.1/Resources/library"
## ACTCD     "/Library/Frameworks/R.framework/Versions/3.1/Resources/library"
## ada       "/Library/Frameworks/R.framework/Versions/3.1/Resources/library"
## adabag    "/Library/Frameworks/R.framework/Versions/3.1/Resources/library"
##           Version   Priority Depends                      Imports
## abind     "1.4-0"   NA       "R (>= 1.5.0)"               NA
## acepack   "1.3-3.3" NA       NA                           NA
## acss.data "1.0"     NA       "R (>= 2.10)"                NA
## ACTCD     "1.0-0"   NA       "R (>= 2.15.1), R.methodsS3" NA
## ada       "2.0-3"   NA       "R(>= 2.10),rpart"           NA
## adabag    "3.2"     NA       "rpart, mlbench, caret"      NA
##           LinkingTo Suggests Enhances License              License_is_FOSS
## abind     NA        NA       NA       "LGPL (>= 2)"        NA
## acepack   NA        NA       NA       "MIT + file LICENSE" NA
## acss.data NA        NA       NA       "GPL (>= 2)"         NA
## ACTCD     NA        NA       NA       "GPL (>= 2)"         NA
## ada       NA        NA       NA       "GPL"                NA
## adabag    NA        NA       NA       "GPL (>= 2)"         NA
##           License_restricts_use OS_type MD5sum NeedsCompilation Built
## abind     NA                    NA      NA     NA               "3.1.1"
## acepack   NA                    NA      NA     "yes"            "3.1.0"
## acss.data NA                    NA      NA     "no"             "3.1.0"
## ACTCD     NA                    NA      NA     "yes"            "3.1.1"
## ada       NA                    NA      NA     NA               "3.1.0"
## adabag    NA                    NA      NA     "no"             "3.1.0"
패키지 설치
install.packages("dplyr")
##
## The downloaded binary packages are in
##  /var/folders/_r/ytdlmf5x039_5bzh37xy121r0000gn/T//RtmpypwiTe/downloaded_packages
install.packages("dplyr", repos="http://cran.rstudio.com/")
패키지 정보
Help, RSiteSearch
RSiteSearch("sna")
??sna
Data Handling
- 논리
c(T,F,T)
[1] TRUE FALSE TRUE
- 숫자
is.numeric(3);is.integer(3)
[1] TRUE [1] FALSE
- 문자
is.character("Kim"); is.character(c("Kim",3,5)); is.numeric(c("Kim",3,5))
[1] TRUE [1] TRUE [1] FALSE
Data Handling
\[ \sqrt{2} \times \sqrt{2} \ne 2 \]
sqrt(2) * sqrt(2) == 2
[1] FALSE
3.55555666662314214
[1] 3.556
3.55555666662314214 == 3.556; 3.55555666662314214 == 3.55555666662314214
[1] FALSE [1] TRUE
Data Handling
options(digits=5);3.55555666662314214
[1] 3.5556
options(digits=10);3.55555666662314214
[1] 3.555556667
- 구조
- Matrix
- Data.Frame
- Data.Table
- List
Matrix
x = matrix(NA, nrow=10, ncol=3)
x
##       [,1] [,2] [,3]
##  [1,]   NA   NA   NA
##  [2,]   NA   NA   NA
##  [3,]   NA   NA   NA
##  [4,]   NA   NA   NA
##  [5,]   NA   NA   NA
##  [6,]   NA   NA   NA
##  [7,]   NA   NA   NA
##  [8,]   NA   NA   NA
##  [9,]   NA   NA   NA
## [10,]   NA   NA   NA
x[1,3]=3; x[2,]=c(1,5,7); x[3,]=seq(1,3); x[4,]=1:3; x[5,]=rep(1,3)
x[6,]=sep(5,1,by=-2);
Missing-Handling
x[is.na(x)] = 0
x
##       [,1] [,2] [,3]
##  [1,]    0    0    3
##  [2,]    1    5    7
##  [3,]    1    2    3
##  [4,]    1    2    3
##  [5,]    1    1    1
##  [6,]    5    3    1
##  [7,]    0    0    0
##  [8,]    0    0    0
##  [9,]    0    0    0
## [10,]    0    0    0
Data.Frame
data_ex = data.frame(height=c(168,182,175),weight=c(50,60,70),sex=c("여","남","남"))
data_ex
##   height weight sex
## 1    168     50  여
## 2    182     60  남
## 3    175     70  남
data_ex$married = c(T,F,T)
data_ex[,"bmi"] = data_ex[,"height"]/data_ex[,"weight"]
data_ex
##   height weight sex married         bmi
## 1    168     50  여    TRUE 3.360000000
## 2    182     60  남   FALSE 3.033333333
## 3    175     70  남    TRUE 2.500000000
사용(X)
attach (data_ex);height
## [1] 168 182 175
detach(data_ex);height
## Error: object 'height' not found
사용(O)
with(data_ex, height);subset(data_ex, height>180)
## [1] 168 182 175
##   height weight sex married         bmi
## 2    182     60  남   FALSE 3.033333333
사용 추천
library("dplyr")
data_ex%>%filter(height>180)
##   height weight sex married         bmi
## 1    182     60  남   FALSE 3.033333333
Big - Data
e.x) 미국 휴스턴에서 출발하는 모든 비행기의 2011년 이착륙기록
library("hflights")
library("hflights")
dim(hflights)
## [1] 227496 21
library("hflights")
#hflights
#head(hflights)
hflights[1:3,1:5]
##      Year Month DayofMonth DayOfWeek DepTime
## 5424 2011     1          1         6    1400
## 5425 2011     1          2         7    1401
## 5426 2011     1          3         1    1352
hflights_df = tbl_df(hflights)
hflights_df
## Source: local data frame [227,496 x 21]
##
##      Year Month DayofMonth DayOfWeek DepTime ArrTime UniqueCarrier
## 5424 2011     1          1         6    1400    1500            AA
## 5425 2011     1          2         7    1401    1501            AA
## 5426 2011     1          3         1    1352    1502            AA
## 5427 2011     1          4         2    1403    1513            AA
## 5428 2011     1          5         3    1405    1507            AA
## 5429 2011     1          6         4    1359    1503            AA
## 5430 2011     1          7         5    1359    1509            AA
## 5431 2011     1          8         6    1355    1454            AA
## 5432 2011     1          9         7    1443    1554            AA
## 5433 2011     1         10         1    1443    1553            AA
## ..    ...   ...        ...       ...     ...     ...           ...
## Variables not shown: FlightNum (int), TailNum (chr), ActualElapsedTime
##   (int), AirTime (int), ArrDelay (int), DepDelay (int), Origin (chr), Dest
##   (chr), Distance (int), TaxiIn (int), TaxiOut (int), Cancelled (int),
##   CancellationCode (chr), Diverted (int)
Mean Func
mean(hflights[,"DepTime"]);mean(hflights[,"DepTime"],na.rm=T)
R Base VS dplyr
hflights_df_rep<-rbind(hflights_df,hflights_df,hflights_df)
system.time(mean(as.data.frame(hflights_df_rep)[,"DepTime"],na.rm=T))
##    user  system elapsed
##   0.022   0.001   0.023
system.time(hflights_df_rep%>%select(DepTime)%>%dplyr::summarise(mean(DepTime,na.rm=T)))
##    user  system elapsed
##   0.007   0.001   0.011
rbind vs rbindlist
system.time(rbind(hflights_df,hflights_df,hflights_df))
##    user  system elapsed
##   1.221   0.183   1.452
library("data.table")
##
## Attaching package: 'data.table'
##
## The following object is masked from 'package:hash':
##
##     copy
##
## The following objects are masked from 'package:h2o':
##
##     month, year
##
## The following object is masked from 'package:dplyr':
##
##     last
system.time(rbindlist(list(hflights_df,hflights_df,hflights_df)))
##    user  system elapsed
##   0.034   0.007   0.048
Dplyr
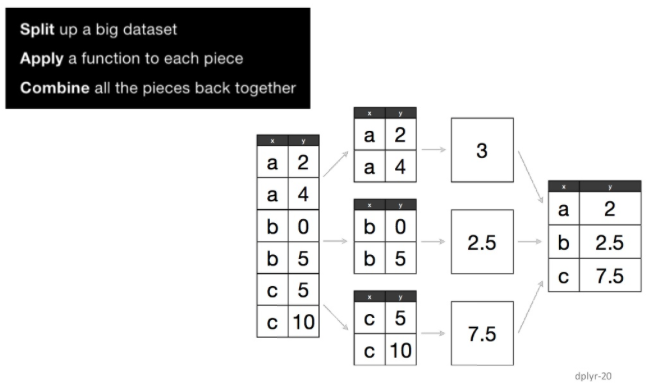

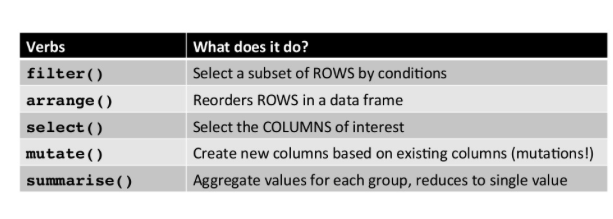
filter: Keep rows Matching Criteria
suppressMessages(library(dplyr))
library(hflights)
flights <- tbl_df(hflights)
flights %>% filter(Month==1, DayofMonth==1)
## Source: local data frame [552 x 21]
##
##    Year Month DayofMonth DayOfWeek DepTime ArrTime UniqueCarrier FlightNum
## 1  2011     1          1         6    1400    1500            AA       428
## 2  2011     1          1         6     728     840            AA       460
## 3  2011     1          1         6    1631    1736            AA      1121
## 4  2011     1          1         6    1756    2112            AA      1294
## 5  2011     1          1         6    1012    1347            AA      1700
## 6  2011     1          1         6    1211    1325            AA      1820
## 7  2011     1          1         6     557     906            AA      1994
## 8  2011     1          1         6    1824    2106            AS       731
## 9  2011     1          1         6     654    1124            B6       620
## 10 2011     1          1         6    1639    2110            B6       622
## ..  ...   ...        ...       ...     ...     ...           ...       ...
## Variables not shown: TailNum (chr), ActualElapsedTime (int), AirTime
##   (int), ArrDelay (int), DepDelay (int), Origin (chr), Dest (chr),
##   Distance (int), TaxiIn (int), TaxiOut (int), Cancelled (int),
##   CancellationCode (chr), Diverted (int)
select: Pick columns by name
flights %>% select(DepTime, ArrTime, FlightNum)
arrange: Reorder Rows
flights %>%
    select(UniqueCarrier, DepDelay) %>%
        arrange(DepDelay) # arrange(desc(DepDelay))
## Source: local data frame [227,496 x 2]
##
##    UniqueCarrier DepDelay
## 1             OO      -33
## 2             MQ      -23
## 3             XE      -19
## 4             XE      -19
## 5             CO      -18
## 6             EV      -18
## 7             XE      -17
## 8             CO      -17
## 9             XE      -17
## 10            MQ      -17
## ..           ...      ...
mutate: Add New Variables
flights %>%
    group_by(Dest) %>%
    summarise(avg_delay = mean(ArrDelay, na.rm=TRUE))%>%slice(1:2)
## Error: could not find function "slice"
a = flights %>%
    group_by(UniqueCarrier) %>%
    summarise(mean_Cancelled = mean(Cancelled),mean_Diverted = mean(Diverted))
a%>%slice(1:3)
## Error: could not find function "slice"
b = flights %>%
    group_by(UniqueCarrier) %>%
    summarise_each(funs(mean), Cancelled, Diverted)
colnames(a) = colnames(b)
all.equal(a,b)
## [1] TRUE
planes<- group_by(flights, TailNum)
delay<-summarise(planes, count=n(),  m_dist = mean(Distance,na.rm=T),
     m_delay = mean(ArrDelay,na.rm=T))%>%filter(m_dist > 0, m_delay > 0, count < 800)


library(ggplot2)
ggplot(delay, aes(m_dist, m_delay)) + geom_point(aes(size = count)) + geom_smooth()

plot(delay[,"m_dist"][[1]],delay[,"m_delay"][[1]],xlab="m_delay",ylab="m_delay",cex=delay[,"count"][[1]]/300)
lines(smooth.spline(delay[,"m_dist"][[1]],delay[,"m_delay"][[1]]),col="red")
데이터 불러오기
- read.csv # base
- fread # data.table
여러개 데이터
fread_multi <- function(allFiles){
    mc <- detectCores();
    cl <- makeCluster(mc);
    DT <- parLapply(cl,allFiles,fun=fread,
                    header=T,
                    stringsAsFactors=F,
                    colClasses=c("character","numeric","character",rep("numeric",48)))
    #call fread on each core (well... using each core at least)
    stopCluster(cl);
    DT <- rbindlist(DT);
    return(DT);
}
write.csv / read.csv
path_dir = "/Users/kimhyungjun/Dropbox/R_lecture/mydeck/r_slide/"
write.csv(delay, file=paste(path_dir,"delay.csv",sep=""),fileEncoding="CP949",
          row.names=FALSE)
header, stringAsFactors, colClasses, fileEncoding, row.names
delay_rep = read.csv(file=paste(path_dir,"delay.csv",sep=""),fileEncoding="CP949")
all.equal(as.data.frame(delay), delay_rep)

delay_rep = read.csv(file=paste(path_dir,"delay.csv",sep=""),fileEncoding="CP949",
                     stringsAsFactors = F)
all.equal(as.data.frame(delay), delay_rep)
여러개 데이터
\[ parallel > lapply \simeq foreach\]
- lapply
- paraellel
- foreach